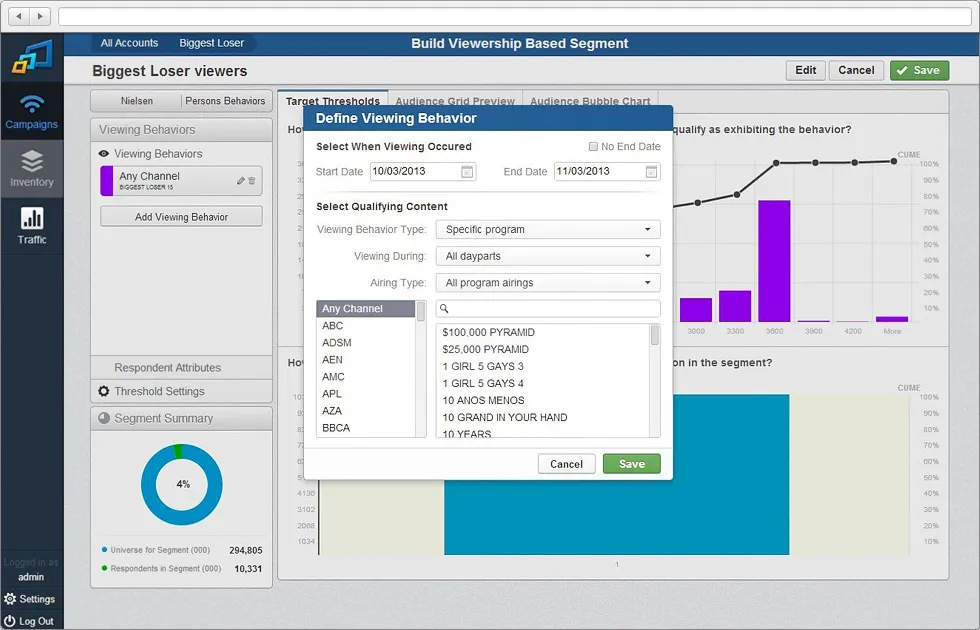
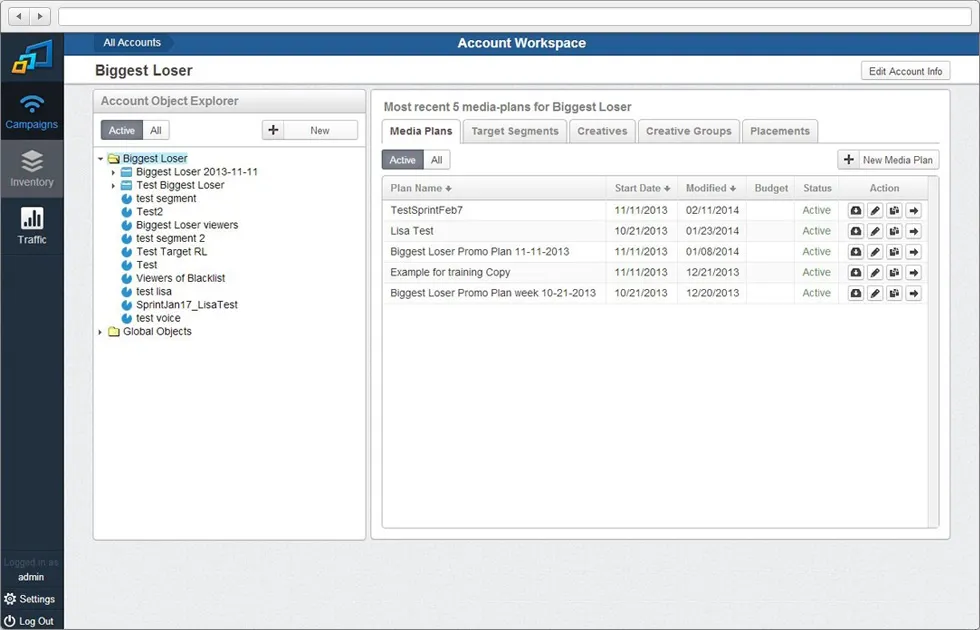
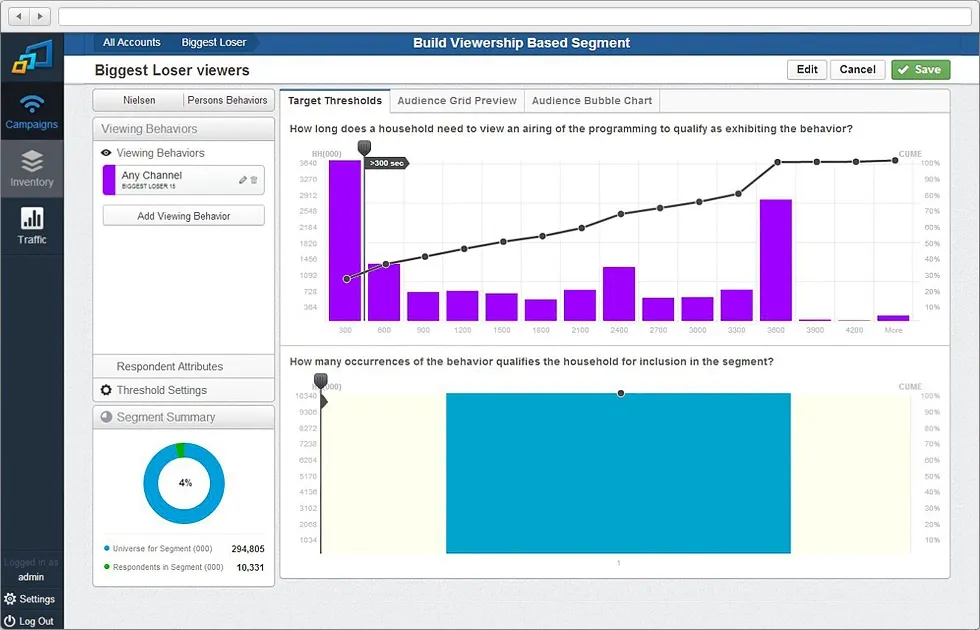
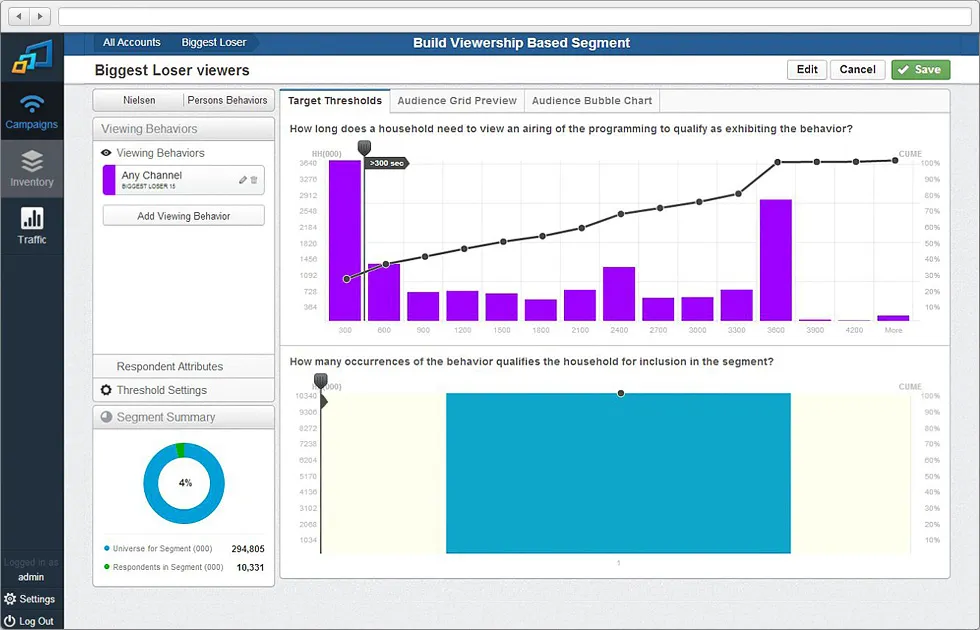
Magora Systems were commissioned to work on the analytical software for a TV-broadcasting company. The project incorporated the development of a data visualization system for presenting statistics on TV audience reach and TV channels popularity.
We based our solution on the D3.js data visualization library, which helps bring data to life using HTML, SVG and CSS. The Audience Management System retrieves the data from the database and performs analytical operations on the client-side. As a result, the TV-audience data is displayed in the form of interactive graphs and charts: pie chart, bubble diagram, pyramid chart. This software facilitates the analysis of audience reach and comes in handy for thousands of TV-programmers and advertisers.
Technology used: D3.js, jQuery, CSS3, HTML.