Through the Thorns to High Load: Clustering on Amazon Web Services

When developing high load applications, it’s necessary to balance the load smartly. A single physical machine doesn’t only create traffic constraints, but also affects system reliability. That’s where clustered web hosting comes in handy. In this post, we will share our experience in clustering using Amazon Web Services Hosting.
As we know, there are two main ways to increase the performance of web applications:
- Vertical scaling , which means increasing the performance of each system component (processor, memory, and other components).
- Horizontal scaling , which consists in joining several elements together, so that the whole system is made up of numerous computational nodes, solving the general problem. This method increases the overall reliability and availability. Performance improvement is achieved by adding supplementary nodes.
The first approach has a significant drawback – the limited capacity of a single computational node. It’s impossible to increase the frequency of the CPU compute kernel and bus bandwidth infinitely. Horizontal scaling doesn’t have this problem, as in the case of performance failure the system can be supplemented with an additional node (or group of nodes).
Let’s consider the example of creating a highly scalable system using the Amazon Web Services infrastructure. We had the task to build a highly reliable social service for fans of college football. The system was to withstand the peak load of 200,000 requests per minute. Usually, the architecture of web applications looks like this:
Fig. 1. Typical web application architecture
-
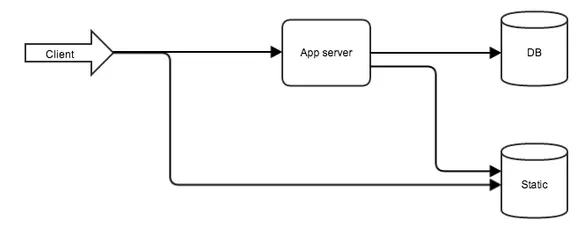
The web server is the first to meet the user and its mission is to transfer the static resources and to forward the requests to the application.
-
Then the baton is passed to the application, where the business logic and database interaction are implemented.
Experience in building high load applications shows that the most frequent bottlenecks in the system are the application code and the database, so we should opt for its parallelisation. Technologies used:
-
development language and core framework – java 7 and rest jersey;
-
application server – tomcat 7;
-
database – MongoDB (NoSQL);
-
cache system – memcached.
High load application in 4 steps
Step 1: “Divide and conquer”.The first thing we should do is optimise the code and queries to the database, and then divide our application into several parts, according to the tasks they fulfill. The following parts should be distributed among several servers:
-
Application servers;
-
Database server;
-
Server with static resources.
For each system participant we should select a server with parameters, tailored specifically to the type of tasks it fulfils.
Application server. The application will benefit from the server with the largest number of processor cores (to serve a large number of concurrent users). Amazon provides a set of Computer Optimized Instances, which is best suited for these purposes.
Database server. The database operation usually implies multiple disk I/O events (writing and reading data). The best option here is a complete set of servers with the fastest hard drive (SSD for example). Again, Amazon provides us with the most optimized version of the servers with the required parameters, e.g. Storage Optimized Instances. We could also do with one of the servers from the General Purpose server product line (large or xlarge), because in the future we are going to scale them.
Static resources. For static resources, we do not need a powerful processor or a large RAM, therefore our choice is a static resources service - Amazon Simple Storage Service.
After the division, the application looks like in Fig. 1.
Division pros:
-
Each element of the system is working on the server, specifically tailored to its needs;
-
The division gives the opportunity to cluster the database; - different elements of the system may be separately tested to search for weaknesses.
However, the app itself remains non clustered; caching servers and session replications are also missing
Step 2: Experiments.For substantial experimenting and performance testing, we need one or more servers with a high bandwidth. User responses will be emulated by the utility Apache Jmeter. This choice is due to the fact that it allows using real access logs from the server as test data or proxying the browser and launching hundreds of parallel threads.
The experiments showed that the resulting performance was insufficient, although the server with the application was loaded 100% (the weakest link was the code of the application). So, let’s parallelise it. We’re adding two new elements:
- Load Balancer;
- Sessions Server.
We found out that our application couldn’t handle the designated load; therefore, the load should be distributed among several servers.
As the load balancer can make another server with a high bandwidth and set up a special software (haproxy, nginx, DNS), but since we work in the Amazon infrastructure we’ll use its existing service ELB (Elastic load balancer). It is very easy to set up and has good performance. The first step is to clone the existing machine with the application for the subsequent addition of a couple of machines to the balancer. The cloning is carried out by means of Amazon AMI. ELB automatically monitors the status of the machines added to the server list, if we implement a simple ping resource that will give 200-value responses to requests.
So, let’s configure the load balancer to work with the two existing application servers and adjust the DNS to work through the load balancer.
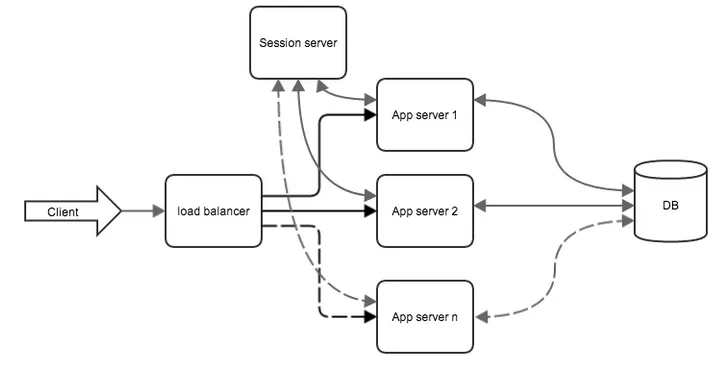
Sessions replication. This point may be skipped if we don’t assign any extra work to the http session in the application, or if we implement a simple REST service. Otherwise, we need all the applications involved in balancing to have access to the shared storage sessions. To store the sessions, we launch another large instance and configure it to a ram memcached repository. We assign the replication sessions to the tomkatu model: memcached-session-manager /5/
Now the system is as follows (the statics server is omitted to simplify the diagram):
Fig. 2 Clustered Application
The results of the application clustering are:
-
Improved reliability of the system. Even in the case of the failure of one of the application servers, the load balancer excludes it from the server list and the system continues to function;
-
To increase the performance of the system we simply need to add another computational node to the application;
-
By adding supplementary nodes, we managed to achieve a peak performance of 70,000 requests per minute.
As the number of application servers increases, so does the load on the database. In the course of time, the database won’t be able to withstand the load. Therefore, it’s necessary to reduce the load on the database.
Step 4: Database OptimisationWe again conduct load testing with Apache Jmeter and this time we find out that the performance of the database is poor. To optimise the database we employed two approaches: data caching queries and database replication for read requests.
Caching. The basic idea of ??caching is that the data, which is most often requested, is saved in RAM. So when the queries are repeated, the first step is to check whether the requested data is cached. In case the data is not in cache, the queries should be forwarded to the database, followed by saving the query results in cache. An additional server with configured memcached and sufficient RAM was deployed for caching.
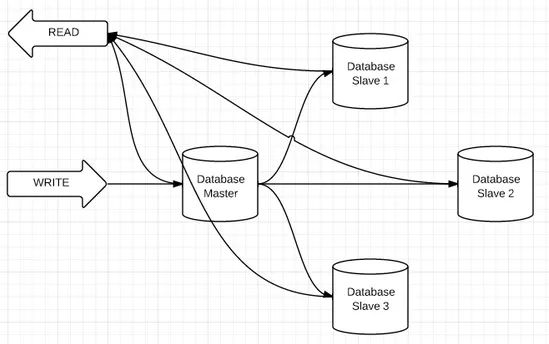
Database replication. The specific character of the application involves more data reading than record. So, let’s clusterise the database for reading. Here we use the replication database. Replication in MongoDB is organised as follows: the database servers are divided into Masters and Slaves. The direct recording of data is allowed only on the master; after the recording, the data is synced on the slave. The reading is allowed on both – masters and slaves.
Fig. 3 Clustered Database
Result
After the division of the application into functional modules and clustering of the bottlenecks we have achieved productivity of 200K requests per minute.


