Google Analytics: Tips and Tricks about Website A/B and Multivariate Testings

Understanding your customer’s wants and needs is crucial to success for businesses in any industry. It is not hard to get to know the customers who walk into your physical shop, but what about those who visit your website? Online buyers are no less important than those you meet face-to-face. But how exactly do you go about learning from them?
Google Analytics is a free tool for website analysis that helps you develop a better understanding of your audience. Using this instrument, you can learn how people interact with your site, how often they visit different pages, where they come from, what attracts their attention and what drives them away.
To help you get the most out of this outstanding tool, we are going to share with you some tips and useful features that will help you to develop an in-depth understanding of your customers.
Testing Your Website with Google Analytics
Building your business website is not a simple task. You cannot know which visual concepts are effective, and which are less
Google Analytics free functionality: A/B and multivariate testing
- A/B testing is the simplest way to check which one of the two designs works best. For example, if you are struggling to select a background colour, all you have to do is to create two pages - the first with one colour as the background and the second with a different one. Then, you simply start the Google Analytics A/B testing mode on both of the pages and wait. At the end of the testing period (which should be set as one of the standard options for this experiment), you will see the favourite. The page which was visited more by users and provided more conversions for your company will be the obvious choice.
How to create your first experiment:
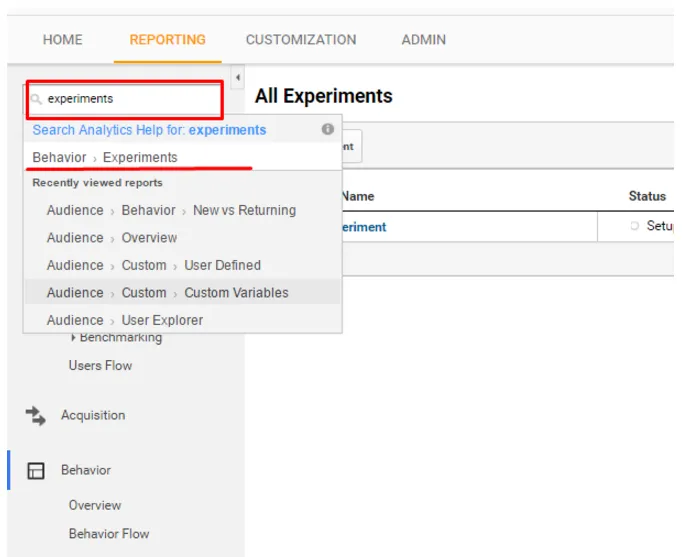
Log in to your Google Analytics account >> Click Reporting >> Jump to the Behavior block and click the button “Start Experiments” or search for the option “Experiments” in the Search box, when you are in the Behavior reporting section - and you will easily find this page for implementation of your first test. (More detailed info is here).

Tips:
- If you want for your experiment to divide the site’s traffic into two equal parts, you have to set percentage of traffic to experiment to 100%, in
other case , if you set the traffic to 50% you will divide the visitorsbetween two pages in a ratio of 3:1. - If choosing between two options is not enough, you can determine which combination of elements works best using multivariate testing.
Multivariate tests vs A/B: which One to Choose?
Multivariate tests are helpful when you need to run several A/B tests on the same page - they will provide for faster results and a greater number of variations. However, it may be extremely difficult to generate the amount of traffic that will produce representative results. The more variants you have, the harder it becomes. In A/B testing, half of the traffic visits each variant, while in a test involving many variations the traffic is split into small segments. This makes it challenging to reach the required number of
FAQ: How much traffic is needed to implement multivariate testing on my site?
- In the experiment’s settings, Google Analytics will predict the approximate length of time to successfully run the test. This is based on your current website visitors flow. Using this information, you can decide to run A/B testing instead, if you think the predicted timeframe is too long.
Remember that continuous testing, implementation of successful variants and website optimisation are the best strategies for conversion gains. If you have any further questions about A/B and multivariate testing implementation, or Google Analytics in general, do not hesitate to contact our experts. Our team is always happy to help.


